
[bibshow file=library.bib key_format=cite]
[wpcol_1half id="" class="" style=""]


[/wpcol_1half]
[wpcol_1half_end id="" class="" style=""]
Toward more realistic networks
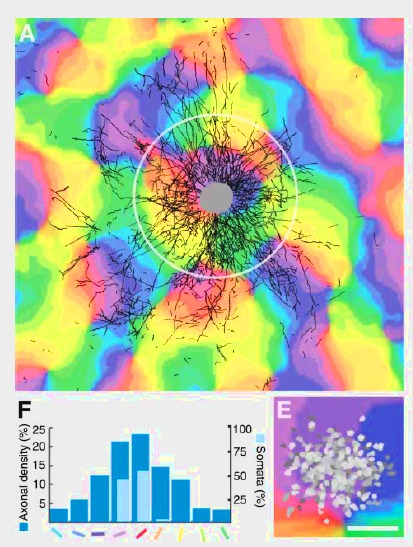
A natural step is to extend the balanced network to topographical and other more realistic networks. Even if homogeneous and random balanced networks are interesting because they capture properties of the neuronal dynamics, they lack more realistic characteristics that can be found in vivo. Considering generic and simple wiring schemes can lead to analytical frameworks where key coding properties such as correlations can be described and predicted. This is for example the work of [bibcite key=Kriener2009], analysing the distribution of pairwise cross-correlations in several random networks in the Asynchronous Irregular regime. Correlations are crucial because they are thought to be a major element in neuronal interactions and the basis of the temporal code. Therefore an important step is to perform a clear and exhaustive study of topographical networks, and especially on how correlations organize in those networks. As already noted in the balanced random network is one of the simplest kinds of network able to generate an irregular activity. But cortical organization seems to be more organized, and anatomical data do not suggest that the connectivity is random. Without knowing if this connectivity is the result of a learning process or hard-wired, we can simply observe that, for example, in V1 neurons are connected in a patchy manner, according to the underlying orientation maps (see Figure from [bibcite key=Stettler2002]). The exact structure of the canonical microcircuits within layers can be assessed by dual recordings in vitro [bibcite key=Binzegger2004,Thomson2003], but such complex organizations, where connections are made not only as a function of distance, but also as a function of other features (preferred orientation, direction selectivity, ...) introduce more complex correlation patterns, and it is important to know what are the relevant quantities that may control such correlation levels.
[/wpcol_1half_end]
[wpcol_1half id="" class="" style=""]
Local connectivity
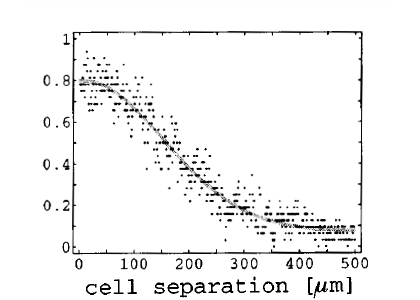
Neuronal connectivity is still poorly understood, but is definitely not as random as it is usually modeled in previous studies. Whether the connectivity graph is small-world (the definition is ambiguous when considering propagation delays), clustered, or Gaussian is still unclear, but biological evidence shows that neurons in the cortex project mainly to their surrounding [bibcite key=Hellwig2000,Bienenstock1996]. As a first approximation, neurons can be considered as being onnected with a distance-dependent probability following a Gaussian profile. Even if it is well known that realistic connectivity is less isotropic and homogeneous (see for example in V1 the orientation maps and the patchy horizontal connectivity [bibcite key=Gilbert1983]), the Gaussian profile is a good description of a small cortical area where long-range interactions are ignored. Therefore, every neuron in our model is connected with the rest of the network according to a 2D Gaussian probability function and a fixed number of output synapses, while periodic boundary conditions are used throughout the study to avoid any border effects.
[/wpcol_1half]
[wpcol_1half_end id="" class="" style=""]
[/wpcol_1half_end]
Conduction delays
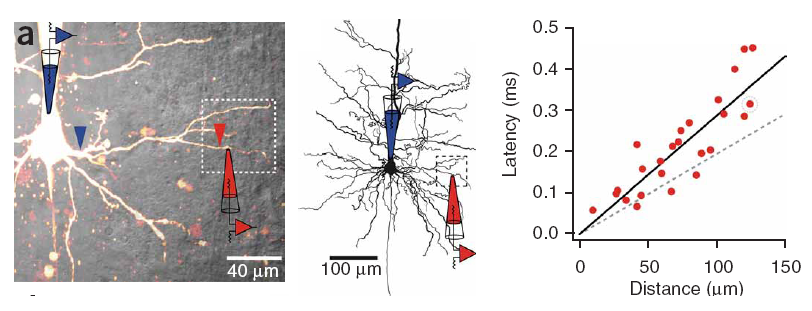
Propagation delays are known to lead to a large diversity of states in large-scale neuronal networks [bibcite key=Roxin2005]. While they are often discarded in large-scale models, under the assumption that they could be neglected in a small cortical area, biological studies [bibcite key=Bringuier1999,Gonzalez-Burgos2000] have reported typical values of 0.1-0.5 m/s for conduction delays, and comparable values can be observed in Voltage Sensitive Dye Imaging, where activity waves propagate at a similar speed [bibcite key=Grinvald1994,Benucci2007,Nauhaus2009]. Patch recordings in vitro also confirm that these delays scale linearly according to distances [bibcite key=Larkum2001]. Thus, even for a small patch of cortex of  , with a synaptic delay of 0.2ms (due to neurotransmitter release), conduction delays are broadly distributed and should not be neglected. Moreover some artificial oscillations could arise in network where delays are homogeneous [bibcite key=Brunel2000].
Simulated dynamics
Here is an example of such a 2D network, with spontaneous activity. Local connectivity, linear delays. What you can see is, at the conductance level, some waves randomly popping up and propagating. Those waves are somehow reflected at the voltage level, but harder to see if just recording the spikes. This is why an in-depth understanding of sub-threshold dynamics is crucial: spikes are just the visible tip of the iceberg.